Go性能诊断工具pprof入门
2020-05-30
测试环境一个api应用突然cpu飙高,稳定在98%……
第一反应是jstack看下是不是代码里有死循环了?然而这是go不是java,只能在go的生态里重新寻找类似工具。
切换语言时,除了改变写代码的语言,有必要熟悉维护应用、定位问题的工具链。这里简单介绍go pprof的使用,以求需要时不必临时google,能以最快速度开始定位问题。
pprof is a tool for visualization and analysis of profiling data.
安装请执行:
go get -u github.com/google/pprof
cpu profile
- 找到容器的IP和debug端口对应的访问端口。
- 执行
go tool pprof -http=:6061 http://$ip:$port/debug/pprof/profile需要一段时间来采样,耐心等待下。采样结束后,将自动在浏览器中打开可视化分析页面。不加-http=:6061时将在终端使用命令行方式交互。
采样数据默认放到~/pprof/目录下,可通过以下命令直接指定文件进行分析。
go tool pprof -http=:6061 ~/pprof/xxx.pb.gz
Top view
效果如下:
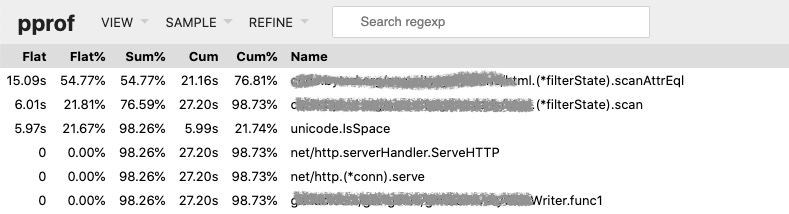
重点是理解Flat、Sum和Cum三个指标。对于函数foo:
func foo(){
    a()                             // step1 takes 1s
    b()                             // step2 takes 1s
    do something directly.          // step3 takes 3s
    c()                             // step4 takes 1s
}
flat是step3的耗时,即3s。cum是foo的整体耗时,包括子函数和直接指令的耗时,即6s。
sum是截至当前行的累计耗时。
上图的例子是调用了一次api的效果(服务器没有其它请求),耗时27s,大部分时间花在go-polaris这个库内,无论哪个指标出发,都很显然要重点看看scanAttrEql函数(结论是该函数死循环了)。
Graph view
按调用层级从上到下显示调用图,需要安装graphviz:
brew install graphviz
括号内的数值同top view。框的大小和箭头的粗细会随着耗时和增加而变大,比较直观。
Flame graph
倒置的火焰图,更常见的形式,也很直观。不展开,可参考如何读懂火焰图?
memory profile
执行:
go tool pprof -http=:6061 http://$ip:$port/debug/pprof/heap
几个view的解读同cpu profile,不再重复。需要指出的是内存分析比较关心的两个指标,通过在命令中添加以下参数可以获得:
- -inuse_space:分析程序常驻内存的占用情况,数值大说明程序当前时刻内存占用较多。
- -alloc_objects:分析内存的临时分配情况,记录程序累计分配的对象,数值大说明有很多对象经常需要临时分配,然后在gc的时候又被释放,对gc的影响比较大。gcPause问题比较严重的时候可以关注这个指标。
其它profile
cpu和memory是常用的的profile类型,值得事先花点时间掌握,其余的可在碰到需求时临时查阅文档。
访问http://$ip:$port/debug/pprof/得到整体可供profile的选项:
- cpu(CPU Profiling): /debug/pprof/profile,默认进行 30s 的 CPU Profiling,得到一个分析用的 profile 文件
- block(Block Profiling):/debug/pprof/block,查看导致阻塞同步的堆栈跟踪
- goroutine:/debug/pprof/goroutine,查看当前所有运行的 goroutines 堆栈跟踪
- heap(Memory Profiling): /debug/pprof/heap,查看活动对象的内存分配情况
- mutex(Mutex Profiling):/debug/pprof/mutex,查看导致互斥锁的竞争持有者的堆栈跟踪
- threadcreate:/debug/pprof/threadcreate,查看创建新OS线程的堆栈跟踪
延伸讨论
启用方式
pprof主要有三种数据获取方式:
- runtime/pprof: 手动调用
runtime.StartCPUProfile或者runtime.StopCPUProfile等 API来生成和写入采样文件 - net/http/pprof: 通过 http 服务获取Profile采样文件,简单易用,适用于对应用程序的整体监控。通过 runtime/pprof 实现。如果在自己的程序中需要支持pprof,推荐此方式,只需要引入这个依赖即可:
import _ "net/http/pprof" - go test: 通过
go test -bench . -cpuprofile prof.cpu生成采样文件 适用对函数进行针对性测试
原理
没有正式的文档,参考golang团队成员ian lance taylor的一段回答:
Is it true that pprof is a stop-the-world sampler? Does it periodically stop the program being profiled to collect information?
No.
Is pprof a statistical/stochastic profile?
Yes.
Is it also an event based profiler?
Yes.
I know it doesn’t run at the kernal level, but where in the OS does pprof profile?
As you say, the net/http/pprof package is basically a wrapper around the runtime/pprof package.
For CPU profiling, runtime/pprof works by periodically interrupting the program. On Unix-like systems, this is done using setitimer to send a periodic SIGPROF signal. When this signal arrive, the goroutine that receives it stores a stack trace. This very briefly stops the goroutine being profiled, but it doesn’t affect the rest of the program.
For heap profiling, the memory allocator tracks the number of allocations it has done, and periodically records a stack trace.
overhead
凡事都有成本,采样时的成本(只有访问debug profile时才会引入该成本,只是引入依赖不会有成本):
pprof is safe to use in production. We target an additional 5% overhead for CPU and heap allocation profiling
另一google员工的描述:
At Google, we continuously profile Go production services and it is safe to do so.
单纯讨论这一成本是高低意义不大,这里涉及一个更大的话题:Continuous Profiling of Go programs
参考文档
微信扫一扫